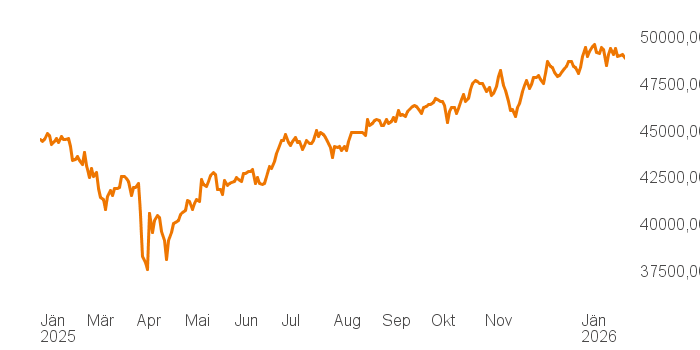
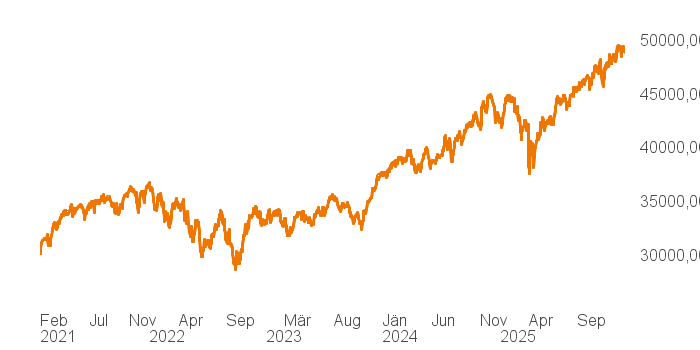
Kursdetails
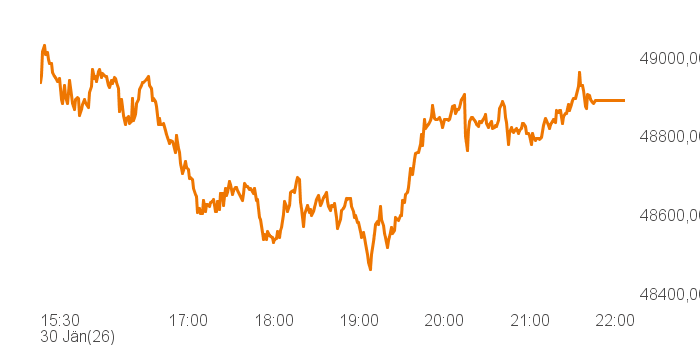
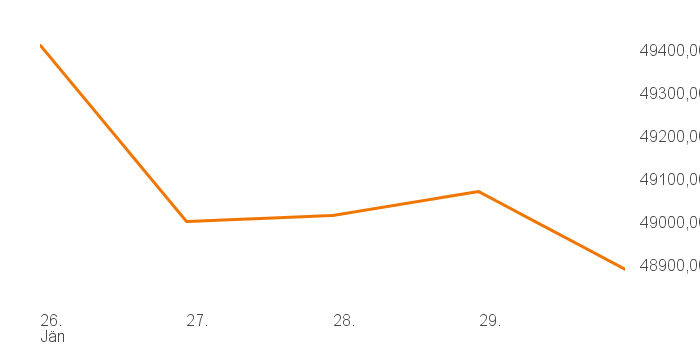
| Vortag Schluss | 49.071,56 (29.01.2026 | 00:00) |
| Tagestief | 48.459,88 |
| Tageshoch | 49.047,68 |
| Eröffnung | 48.991,62 |
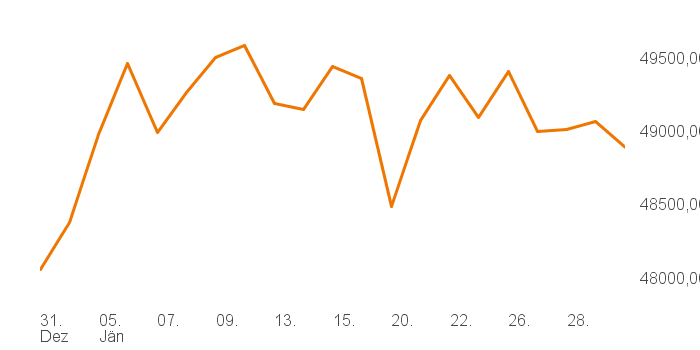
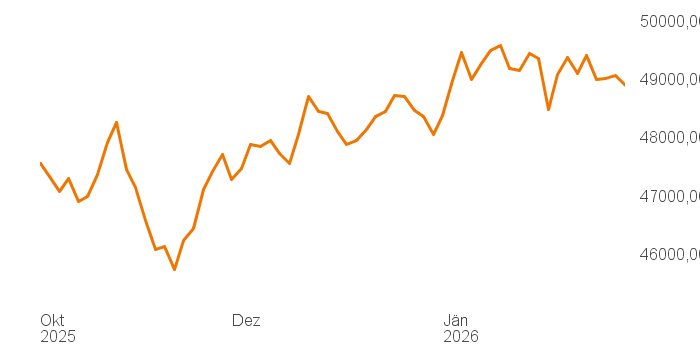
| 52-Wochenhoch | 49.590,20 (12.01.2026 | 00:00) |
| 52-Wochentief | 37.645,59 (08.04.2025 | 00:00) |
Indexwerte
| Aktie | Kurs | Diff% |
| 3M | 153,16 | -2,06% |
| Amazon | 239,30 | -1,01% |
| American Express | 352,17 | -1,77% |
| Amgen | 341,88 | -0,31% |
| Apple | 259,48 | +0,46% |
| Boeing | 233,72 | -0,14% |
| Caterpillar | 657,36 | -1,18% |
| Chevron | 176,90 | +3,34% |
| Cisco | 78,32 | -0,14% |
| Coca-Cola | 74,81 | +1,88% |
| Goldman Sachs | 935,41 | -0,50% |
| Home Depot | 374,59 | +0,75% |
| Honeywell | 204,86 | 0,00% |
| IBM | 306,70 | -0,82% |
| Johnson & Johnson | 227,25 | -0,02% |
| JPMorgan | 305,89 | -0,17% |
| McDonald's | 315,00 | -0,16% |
| MSD | 110,27 | +1,78% |
| Microsoft | 430,29 | -0,74% |
| Nike | 61,81 | -1,26% |
| Nvidia | 191,13 | -0,72% |
| Procter & Gamble | 151,77 | +1,25% |
| Salesforce | 212,29 | -0,84% |
| Sherwin-Williams | 354,64 | +0,02% |
| Travelers | 284,51 | +0,08% |
| Unitedhealth | 286,93 | -1,83% |
| Verizon | 44,52 | +11,83% |
| Visa | 321,83 | -3,00% |
| Walmart | 119,14 | +1,47% |
| Walt Disney | 112,80 | +1,09% |
Top & Flop
| Top | Aktuell | Diff% |
| Verizon | 44,52 | +11,83% |
| Chevron | 176,90 | +3,34% |
| Coca-Cola | 74,81 | +1,88% |
| MSD | 110,27 | +1,78% |
| Walmart | 119,14 | +1,47% |
| Flop | Aktuell | Diff% |
| Visa | 321,83 | -3,00% |
| 3M | 153,16 | -2,06% |
| Unitedhealth | 286,93 | -1,83% |
| American Express | 352,17 | -1,77% |
| Nike | 61,81 | -1,26% |
Performance
| Volumen | 761.991.988,00 |
| Jahreshoch | 49.590,20 (12.01.2026 | 00:00) |
| Jahrestief | 48.382,39 (02.01.2026 | 00:00) |
| Durchschn. Preis 1 Jahr | 44.749,83 |
| Durchschn. Preis 1 Monat | 49.087,08 |


